

Views: 112 Author: kangli Publish Time: 2026-11-06 Origin: Site


Content Menu
● Wheelchair Distributor Replenishment: How to Set Reorder Points by Model and Size
>> Why Reorder Points Must Be Set by Model and Size
>> The Reorder Point Formula for Wheelchair Distributors
>> How to Calculate Your True Wheelchair Lead Time
>>> Example Lead Time Build-Up
>> How Much Safety Stock Does Each Wheelchair Size Need?
>> Worked Example: Reorder Points by Seat Width
>> Check Stock Position, Not Just the Warehouse Shelf
>> Set Different Rules for Fast, Slow and Erratic Models
>> Clean Your Sales Data Before You Trust the Numbers
>> What to Do When a Wheelchair Shipment Is Delayed
>> Turn Reorder Signals into a Container Order
>> Plan Your Wheelchair Replenishment with Kangli
>>> What is a good reorder point for wheelchairs?
>>> Should wheelchair lead time include ocean freight?
>>> How often should distributors review reorder points?
>>> Can I replace an out-of-stock size with another size?
>>> How much safety stock should I keep?
>>> What if my sales are too low to calculate a reorder point?
>> References
By Yuki, head of export at Tianjin Kangli Medical Appliance Co., Ltd.
Planning your next wheelchair reorder? Talk to our export team directly.WhatsApp: +86 136 5207 7555Email: yukili90@tjkangli.com
Wheelchair distributor replenishment works best when you stop asking, "How many chairs do we have?" and start asking, "How many of this model and size do we need before the next shipment arrives?" A total stock figure can look healthy while your most popular seat width is about to run out.
I run the export department at Kangli, a family-owned Tianjin manufacturer founded in 1998. We make wheelchairs, hospital beds and medical stainless steel products, and we provide OEM services for overseas brands, wholesalers and manufacturers. This guide shows you how to set reorder points by model and size, using a formula that your team can maintain in a spreadsheet.

Every size of every model is its own stock item. Common adult seat widths include 16, 18 and 20 inches, plus wider heavy-duty sizes [1]. WHO also notes that no single model or size can meet the needs of all users [2].
So a chair is not automatically replaceable by the next size. A hospital may accept a substitute model, but a user who needs a specific fit may not. Do not plan a size swap as your backup for a stockout.
Treat each combination as one SKU. For example:
Standard steel chair, 16-inch
Standard steel chair, 18-inch
Lightweight chair, 18-inch
Heavy-duty chair, 22-inch
If you also sell different tyres, colours or brands, ask whether they need separate SKUs too.
The core formula is simple:
Reorder Point = Lead Time Demand + Safety Stock [3]
Lead time demand is what you expect to sell while new stock is on its way.
Safety stock protects you when sales run higher or the shipment runs later.
Lead time demand equals average daily sales multiplied by lead time in days. BoxHero recommends measuring the whole period from placing an order until goods are ready to use, including processing, production, transit and receiving [3]. For an importer, this is where most mistakes begin.
Use units carefully. SPS Commerce warns that mismatched time units produce wrong results without warning [4]. If demand is daily, lead time must also be in days.
Your lead time starts on the day you decide to order, not on the day the ship sails. Add every stage:
Order processing: Quantity check, purchase order, deposit
Production: Factory time for the order
Origin handling: Booking, inland transport, port time
Ocean transit: Port to port
Destination handling: Customs, delivery, receiving
At Kangli, 200 wheelchairs usually take about 15 working days after we receive your deposit. Final delivery dates are confirmed with each customer directly. OEM packaging, labels and special parts should be checked before you plan.
Ocean time is your biggest moving part. Here are recent published estimates:
| Route | Published estimate | Notes |
|---|---|---|
| Shanghai to Rotterdam via Cape | 42–46 days | Via Suez was given as 30–32 days [5] |
| Qingdao to Rotterdam, direct | 38–55 days | Same guide suggests a 5–7 day buffer [6] |
| Tianjin to Jebel Ali | 21–25 days | Carrier benchmark, varies by service [7] |
These are planning estimates from 2026 logistics articles, not quotes. Routes and conditions change quickly, so confirm the current schedule with your forwarder. Topway Shipping also reports that LCL consolidation typically adds 3–7 days on the Jebel Ali lane [7].

| Stage | Europe example (days) | Gulf example (days) |
|---|---|---|
| Order processing | 5 | 5 |
| Production | 21 | 21 |
| Origin handling | 7 | 7 |
| Ocean transit | 46 | 23 |
| Destination handling | 7 | 7 |
| Total | 86 | 63 |
These figures are illustrative. Replace them with records from your last few shipments. BoxHero suggests using the longest reasonable lead time when your lead times vary a lot [3].
Safety stock should reflect both uncertain sales and uncertain delivery. SPS Commerce gives a simple starting point and a more complete formula [4].
Simple method, when your history is limited:
(Maximum daily sales × Maximum lead time) − (Average daily sales × Average lead time)
This method can over-buffer, because peak sales and the longest delay rarely happen in the same cycle [4].
Better method, when you have reliable data:
Safety Stock = Z × √(Lead time × Demand SD² + Average demand² × Lead time SD²)
"SD" means standard deviation. Z reflects your target service level. SPS Commerce lists 1.28 for 90%, 1.65 for 95% and 2.33 for 99% [4].
Raising service levels costs more than many people expect. In SPS Commerce's example, moving from 90% to 99% nearly doubles the buffer [4]. Do not give every SKU the highest target.
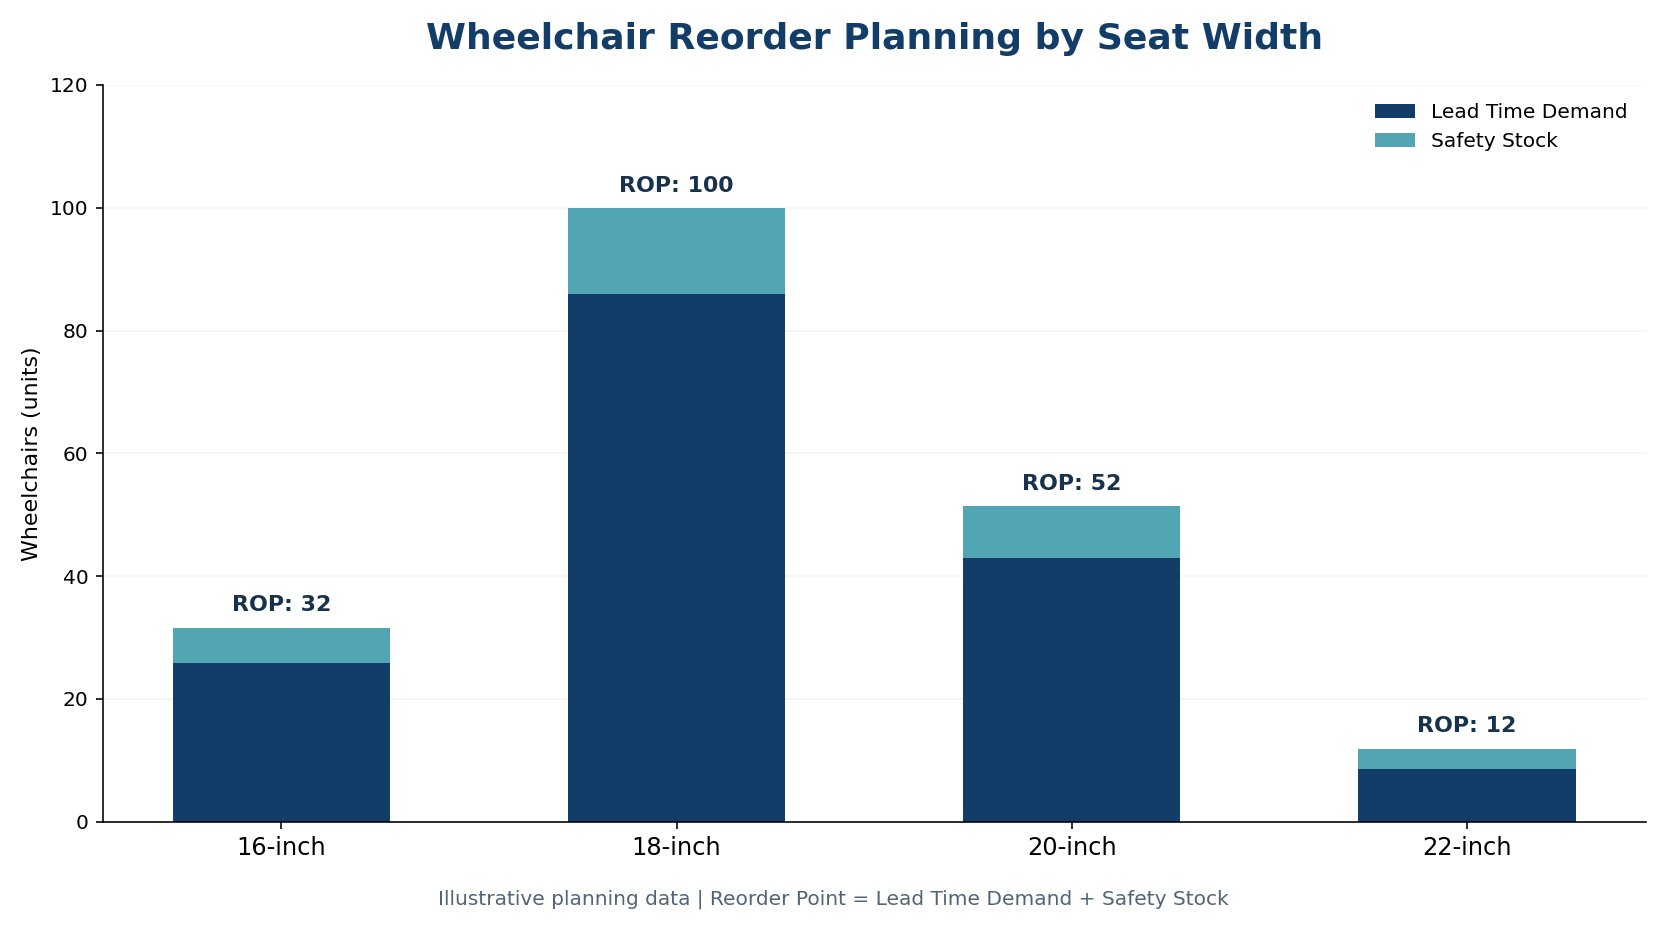
Here is the full method for one model. All sales data below is invented for illustration. It uses the 86-day Europe example, a lead time SD of 7 days and a 95% target, so Z = 1.65.
| Seat width | Monthly sales | Daily demand | Daily demand SD | Lead time demand | Safety stock | Reorder point |
|---|---|---|---|---|---|---|
| 16-inch | 9 | 0.3 | 0.3 | 25.8 | 5.8 | 32 |
| 18-inch | 30 | 1.0 | 0.5 | 86.0 | 13.9 | 100 |
| 20-inch | 15 | 0.5 | 0.4 | 43.0 | 8.4 | 52 |
| 22-inch | 3 | 0.1 | 0.2 | 8.6 | 3.3 | 12 |
Reorder points are rounded up. Look at the 22-inch line. Its reorder point is four times its monthly sales. That is normal when lead time is close to three months. It does not mean you should treat that stock as excess.
Want help checking your lead time? Send your model list and destination port to Yuki on WhatsApp: +86 136 5207 7555 or by email at yukili90@tjkangli.com.
With ocean freight, many reorder mistakes come from ignoring goods already on the way. Compare your reorder point with your stock position:
Stock Position = On Hand + On Order − Backorders − Reserved Stock
Suppose you hold 70 of the 18-inch chair, with 60 already at sea and 10 reserved. Your stock position is 120, so you are still above the reorder point of 100. Without this check, your team could place a second order for chairs that are already coming.
Keep one line per SKU with these columns:
| Column | Example |
|---|---|
| SKU | Standard chair, 18-inch |
| On hand | 70 |
| On order | 60 |
| Backorders and reserved | 10 |
| Stock position | 120 |
| Reorder point | 100 |
| Action | Wait |
One service target cannot fit every wheelchair. ABC-XYZ analysis gives each SKU a simple category. A supply chain guide ranks items by annual value, then by how predictable demand is [8].
| Group | Typical wheelchair SKU | Suggested policy |
|---|---|---|
| A, stable | Best-selling 18-inch model | Review often and keep it in stock |
| B, seasonal | Lightweight home care model | Adjust the forecast by season |
| C, erratic | Rare wide size | Use a low fixed minimum or order to demand |
That guide's typical ABC bands put Class A at around 70–80% of value and 15–25% of SKUs. It treats demand as stable with a coefficient of variation below 0.5, and erratic above 1.0 [8]. Use these as starting points, not fixed rules.
My view: Do not let the formula overrule your market knowledge. If a low-volume wide chair supports an important hospital customer, you may choose to keep a small minimum.
A formula is only as good as its inputs. SPS Commerce warns that incomplete history or outdated lead times will skew the result [4]. Check these before you calculate:
Remove one-off tenders. Plan a large hospital order as a project, not as normal demand.
Adjust for stockouts. Zero sales during a stockout does not mean zero demand.
Separate your channels. Dealer orders and hospital orders can behave differently.
Use units shipped, not units quoted. Quotes are not demand.
Include seasonality. BoxHero suggests using different usage rates for different seasons [3].
Include growth. If sales are rising, past data may understate your needs [3].

A delay is a planning event, not just a logistics problem. Published sources show why it matters. Great Hensen advises budgeting at least 5–7 extra days beyond a carrier's quoted transit time [6]. Topway Shipping reports that a missed transfer at Singapore can add four to seven days on one Jebel Ali service [7].
When a delay notice arrives, I suggest these steps:
Update the arrival date in your stock report the same day.
Calculate days of cover for each SKU. Divide stock on hand by average daily sales.
Mark the SKUs that will run out before the new arrival date.
Protect committed orders first. Reserve stock for hospitals and dealers with confirmed orders.
Tell customers early. A clear new date is better than a surprise.
Review your next order. If the delay continues, add it to your lead time and safety stock.
Keep the record too. Note the planned date, the actual date and the reason for each shipment. After a few orders, your own data will be more useful than any general article.
For urgent gaps, compare the cost before you act. A smaller LCL shipment or air freight may protect a key customer, but it can also erase the margin on that order.
A reorder point tells you when to act. It does not tell you to ship one SKU alone. Importers usually need to combine SKUs to make freight worthwhile.
I suggest this routine:
Run the report on a fixed day. Weekly works well for many teams.
Flag any SKU at or below its reorder point. This triggers an order review.
Check the other SKUs. Add those close to their reorder points.
Calculate the volume. Compare LCL and FCL with your forwarder.
Confirm production dates before you promise stock to customers.
This is where our guide to mixed wheelchair orders can help. It explains how to combine models and sizes from one factory.
Review your settings regularly. SPS Commerce recommends recalculating at least quarterly, or whenever demand or lead time patterns shift [4]. Add spare parts to the same review, because a chair waiting for a castor is also a lost sale.
Good replenishment needs a supplier that shares clear production information. We provide OEM services for overseas brands, wholesalers and manufacturers. We hold ISO 13485:2016 certification, valid to 14 April 2028, and a CE Declaration of Conformity under EU MDR 2017/745 for Class I manual wheelchairs.
Send us your model list, sizes, annual volume and destination port. We will discuss production timing and how we can support your reorder plan.
WhatsApp: +86 136 5207 7555
Email: yukili90@tjkangli.com
Website: www.klmedbed.com
There is no single number. Calculate it for each model and size: lead time demand plus safety stock [3].
Yes. Include order processing, production, origin handling, ocean transit, customs and receiving [3].
At least quarterly, and sooner if sales or shipping times change [3][4]. Check your stock report more often, such as weekly.
Not automatically. WHO says no single size meets all users' needs [2]. Discuss any substitution with the customer and the person responsible for fitting.
It depends on sales variation, lead time variation and your service target. Start with the simple method if your data is limited, then move to the fuller formula [4].
Use a low fixed minimum, or order to demand. Review the decision if the SKU matters to an important customer.
1800wheelchair. Wheelchair Sizing Guide.
World Health Organization. Wheelchair services.
SPS Commerce. How to Calculate Safety Stock: Formulas and Methods That Fit Your Data.
GoFreight. Maritime Disruption 2026: Red Sea, Suez and Hormuz Impact on Ocean Freight. July 2026.
Great Hensen. China to Europe Sea Freight Transit Times: Port-by-Port Guide. July 2026.
Topway Shipping. Transit Time War: Comparing COSCO, MSC and Evergreen on the China–Jebel Ali Corridor in 2026. May 2026.
SCM Dojo. ABC-XYZ Analysis: Complete Methodology Guide.


